LibraryDocsPricingHome
  • App shell
  • Dashboard overview
  • Sign in
  • Sign up
  • Onboarding checklist
  • Settings layout
  • Profile settings
  • Danger zone
  • Data table
  • Empty states
  • Analytics reportPro
  • Setup wizardPro
  • Invite teammatesPro
  • Notification preferencesPro
  • SecurityPro
  • IntegrationsPro
  • Plan pickerPro
  • Usage and limitsPro
  • Invoice historyPro
  • Payment methodsPro
  • Cancel flowPro
  • Members tablePro
  • Roles and permissionsPro
  • Audit logPro
  • Record detailPro
  • Database viewPro
  • Kanban boardPro
  • CSV importPro
  • Calendar and schedulePro
  • Notification centerPro
  • Activity feedPro
  • Home with agentsPro
  • Agent chatPro
  • Agent side panelPro
  • Approvals inboxPro
  • Agents directoryPro
  • Agent settingsPro
  • Agent run detailPro
  • Bulk change reviewPro
  • Agent monitor
  • Alert
  • App logo
  • Avatar
  • Badge
  • Breadcrumb
  • Button
  • Card
  • Checkbox
  • Command menu
  • Compact breakdown
  • Connection access row
  • Date picker
  • Date range picker
  • Dialog
  • Dropdown menu
  • Dropzone
  • Empty state
  • Field
  • Field suggestion
  • Filter menu
  • Input
  • KPI chart
  • Kbd
  • OTP input
  • Pagination
  • Popover
  • Profile menu
  • Progress
  • Radio group
  • Running now
  • Segmented control
  • Select
  • Separator
  • Setup guide
  • Sidebar
  • Skeleton
  • Spinner
  • Stepper form
  • Switch
  • Table
  • Tag input
  • Textarea
  • Time picker
  • Toast
  • Toggle group
  • Tooltip
  • Usage meter
  • Billing schedulePro
  • Breakdown chartPro
  • Comment threadPro
  • Integration pickerPro
  • Integration settingsPro
  • AI answerPro
  • Approval cardPro
  • Attachment chipPro
  • Chat composerPro
  • Code blockPro
  • Inline diffPro
  • Message actionsPro
  • Model pickerPro
  • Suggestion chipsPro
  • Thinking loaderPro
  • Thinking statePro
  • Tool call cardPro
  • User messagePro
  • Agent checkpointsPro
  • Agent fleetPro
  • Agent inboxPro
  • Agent lanesPro
  • Agent trailPro
  • Approval that escalatesPro
  • Autonomy dialPro
  • Away summaryPro
  • Bulk change reviewPro
  • Context windowPro
  • Decision cardPro
  • Delegate fieldPro
  • Diff timelinePro
  • Escalation rulesPro
  • Guidance layersPro
  • Memory panelPro
  • Memory suggestionPro
  • Promote to recurringPro
  • Resource access pickerPro
  • Run log with undoPro
Sign inGet Pro
LibraryCharts

Shadcn charts for SaaS dashboards

The charts a product dashboard actually needs: one number and its trend, a total split into parts, usage against a limit. Each one is a typed React component that takes your data as props.

8 items, 5 free

Data
KPI chart

One headline number with its change and a line per series, with a hover guide and tooltip.

Sign in to copy
Data
Compact breakdown

One total split into a few parts: a segmented bar, a legend with amounts and shares, and a range switch.

Sign in to copy
Data
Usage meter

Plan usage: credits against the limit, the split by feature, a bar per day and the quotas.

Sign in to copy
BusinessPro
Breakdown chart

Stacked bars over time with selects for measure, grouping and split, and a totals table.

Pro, unlock to copy
Feedback
Progress

A thin bar on a gray track for work with a known length.

Sign in to copy
Shell
Dashboard overview

The home page of the product: date range, a KPI row, the main chart, a breakdown, plan usage and recent activity.

Sign in to copy
DataPro
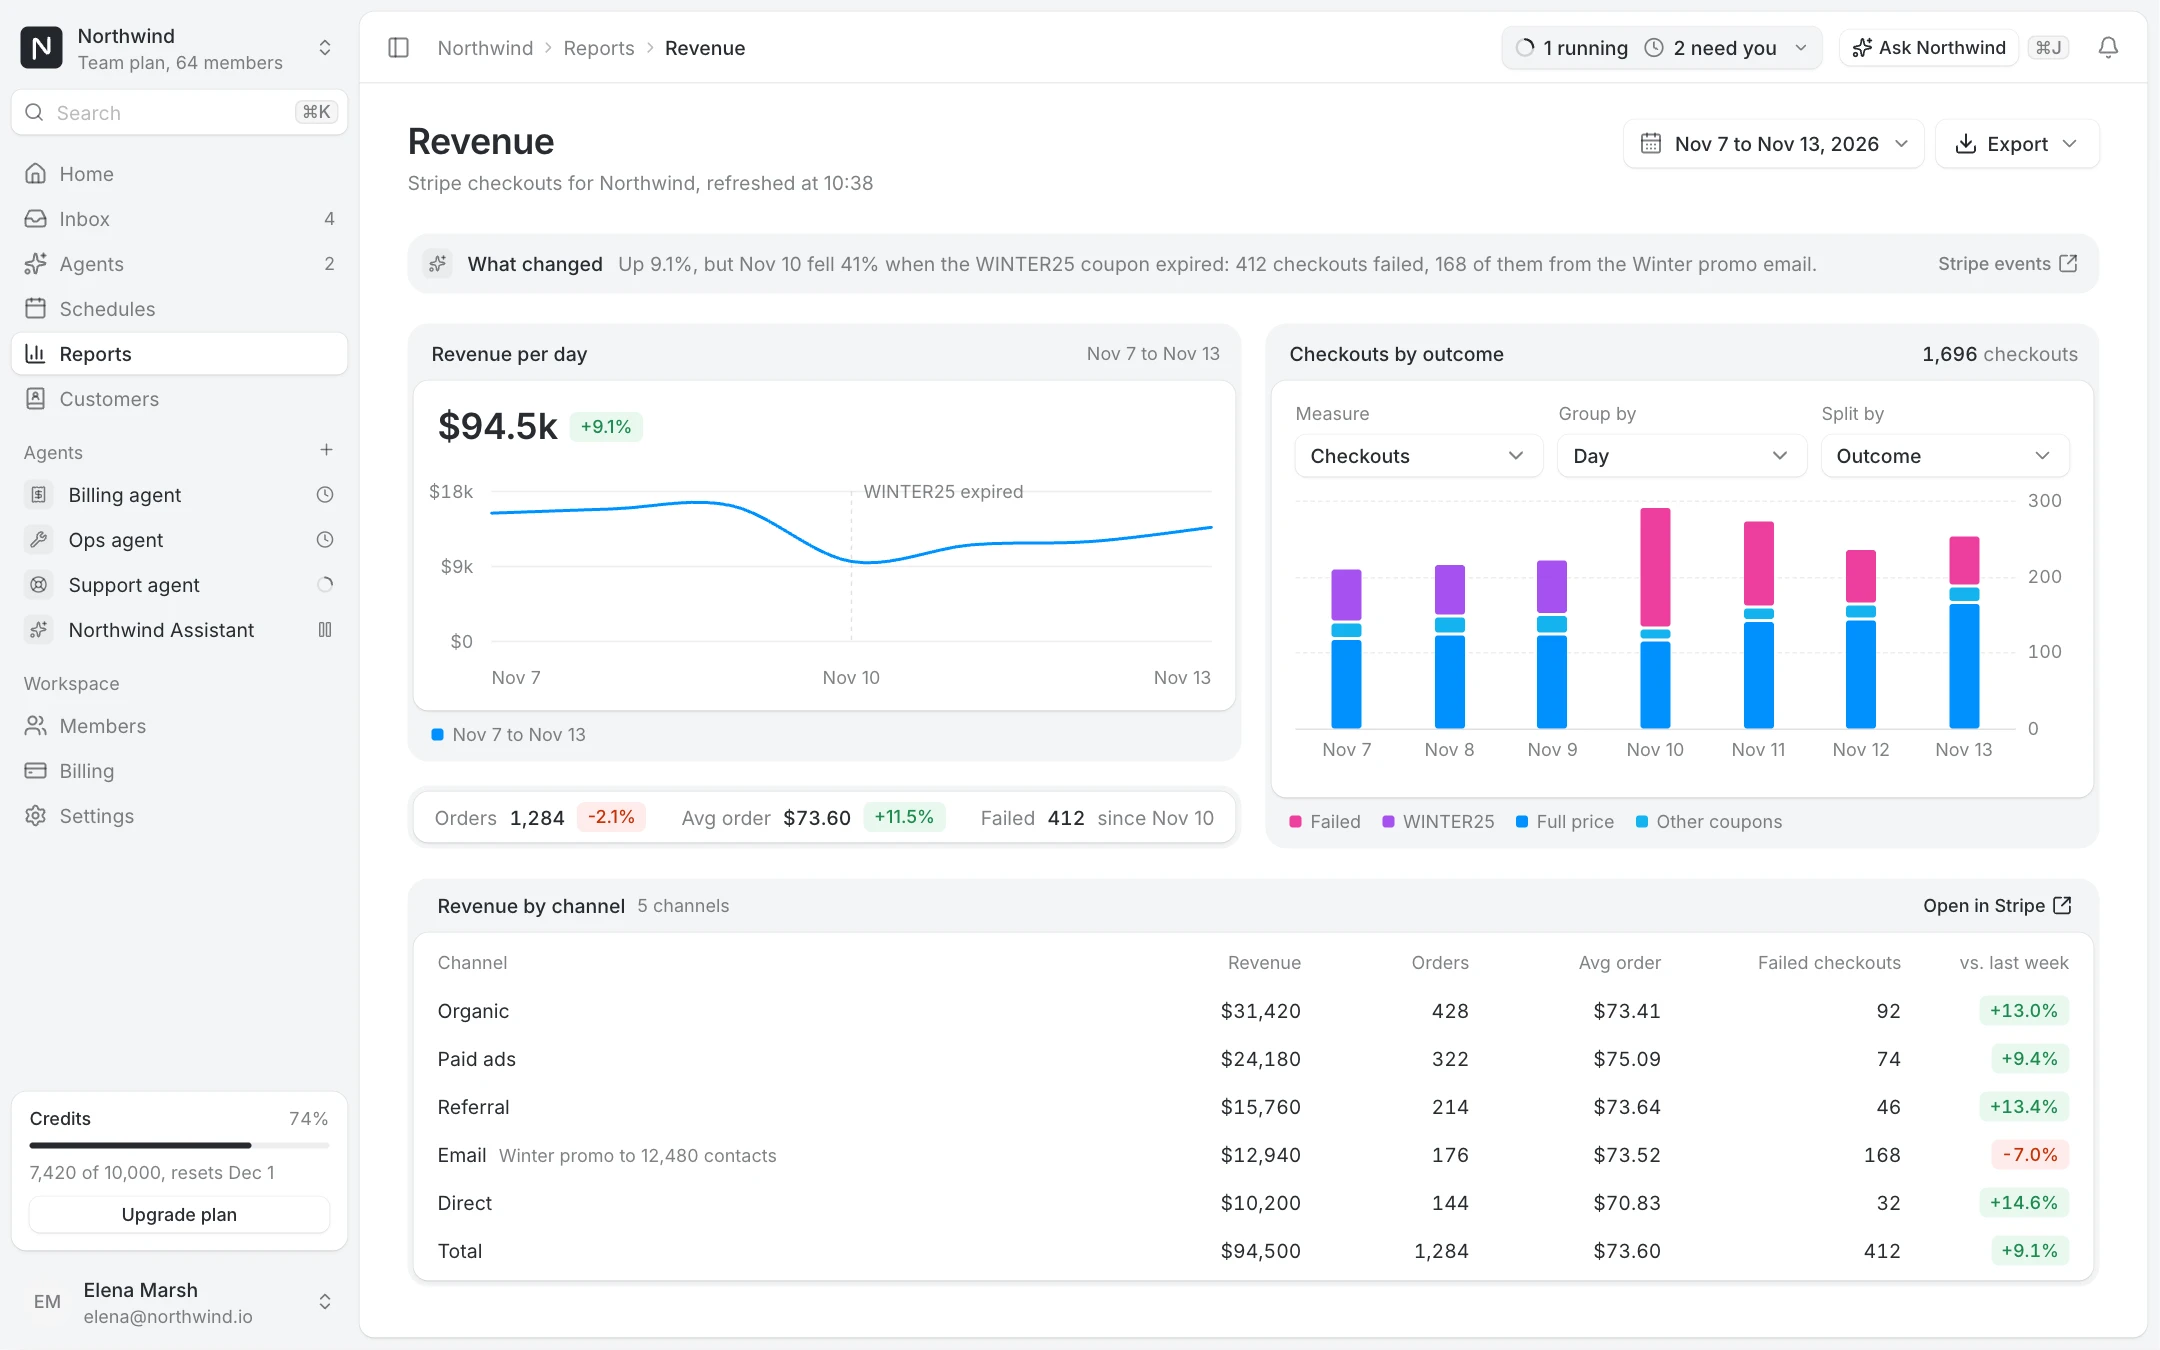
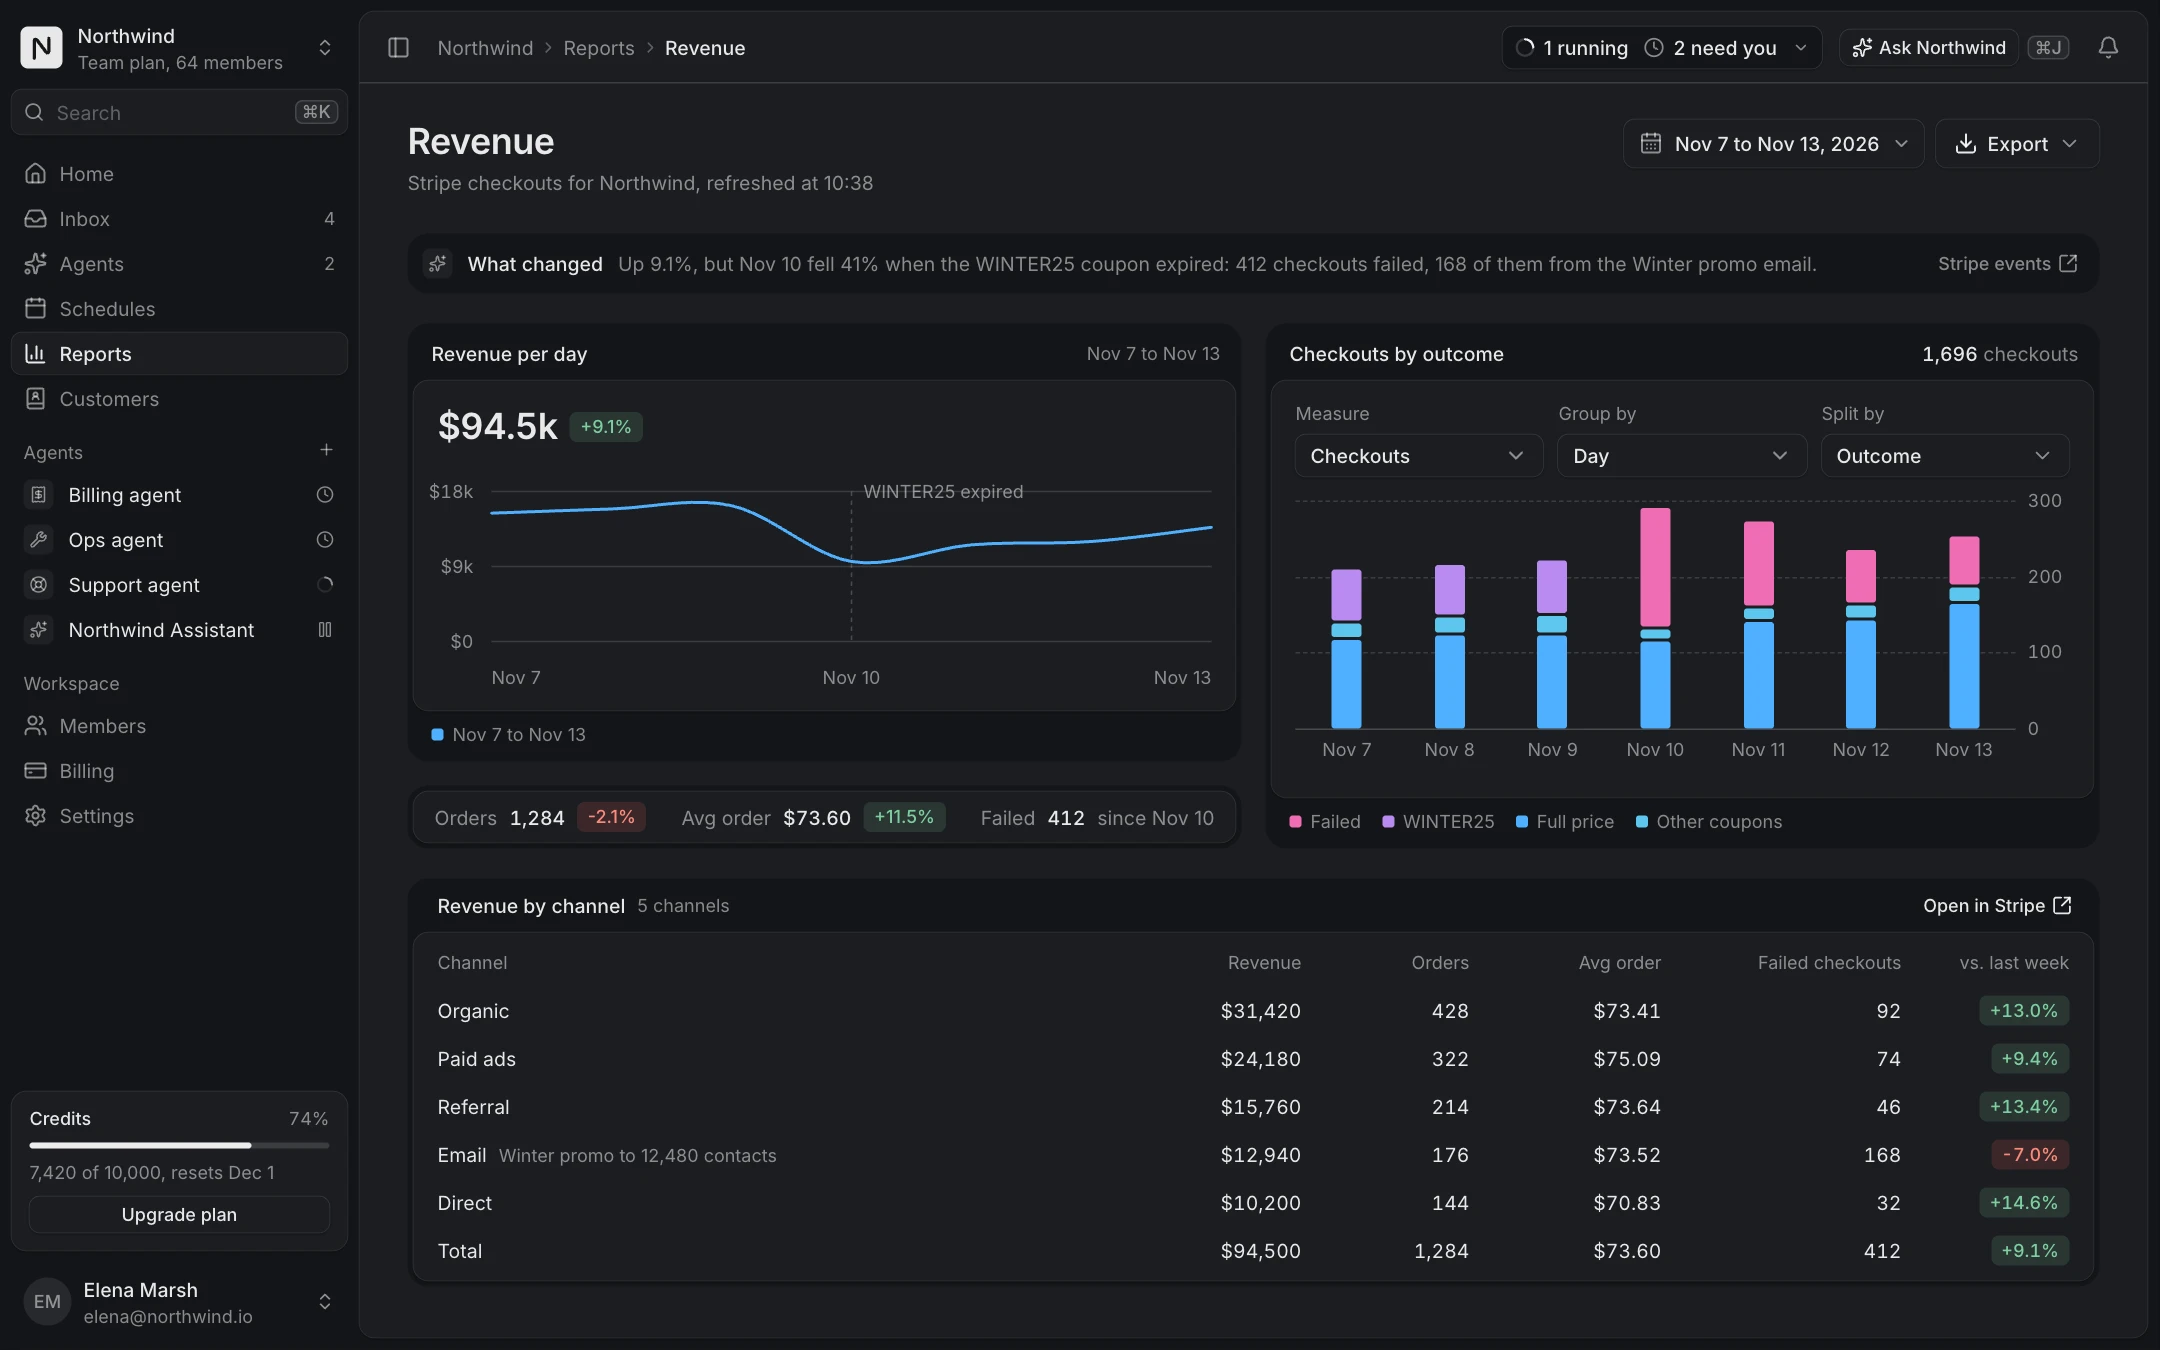
Analytics report

Date range with compare, revenue per day, checkouts by outcome, the channel table and export.

Pro, unlock to copy
BillingPro
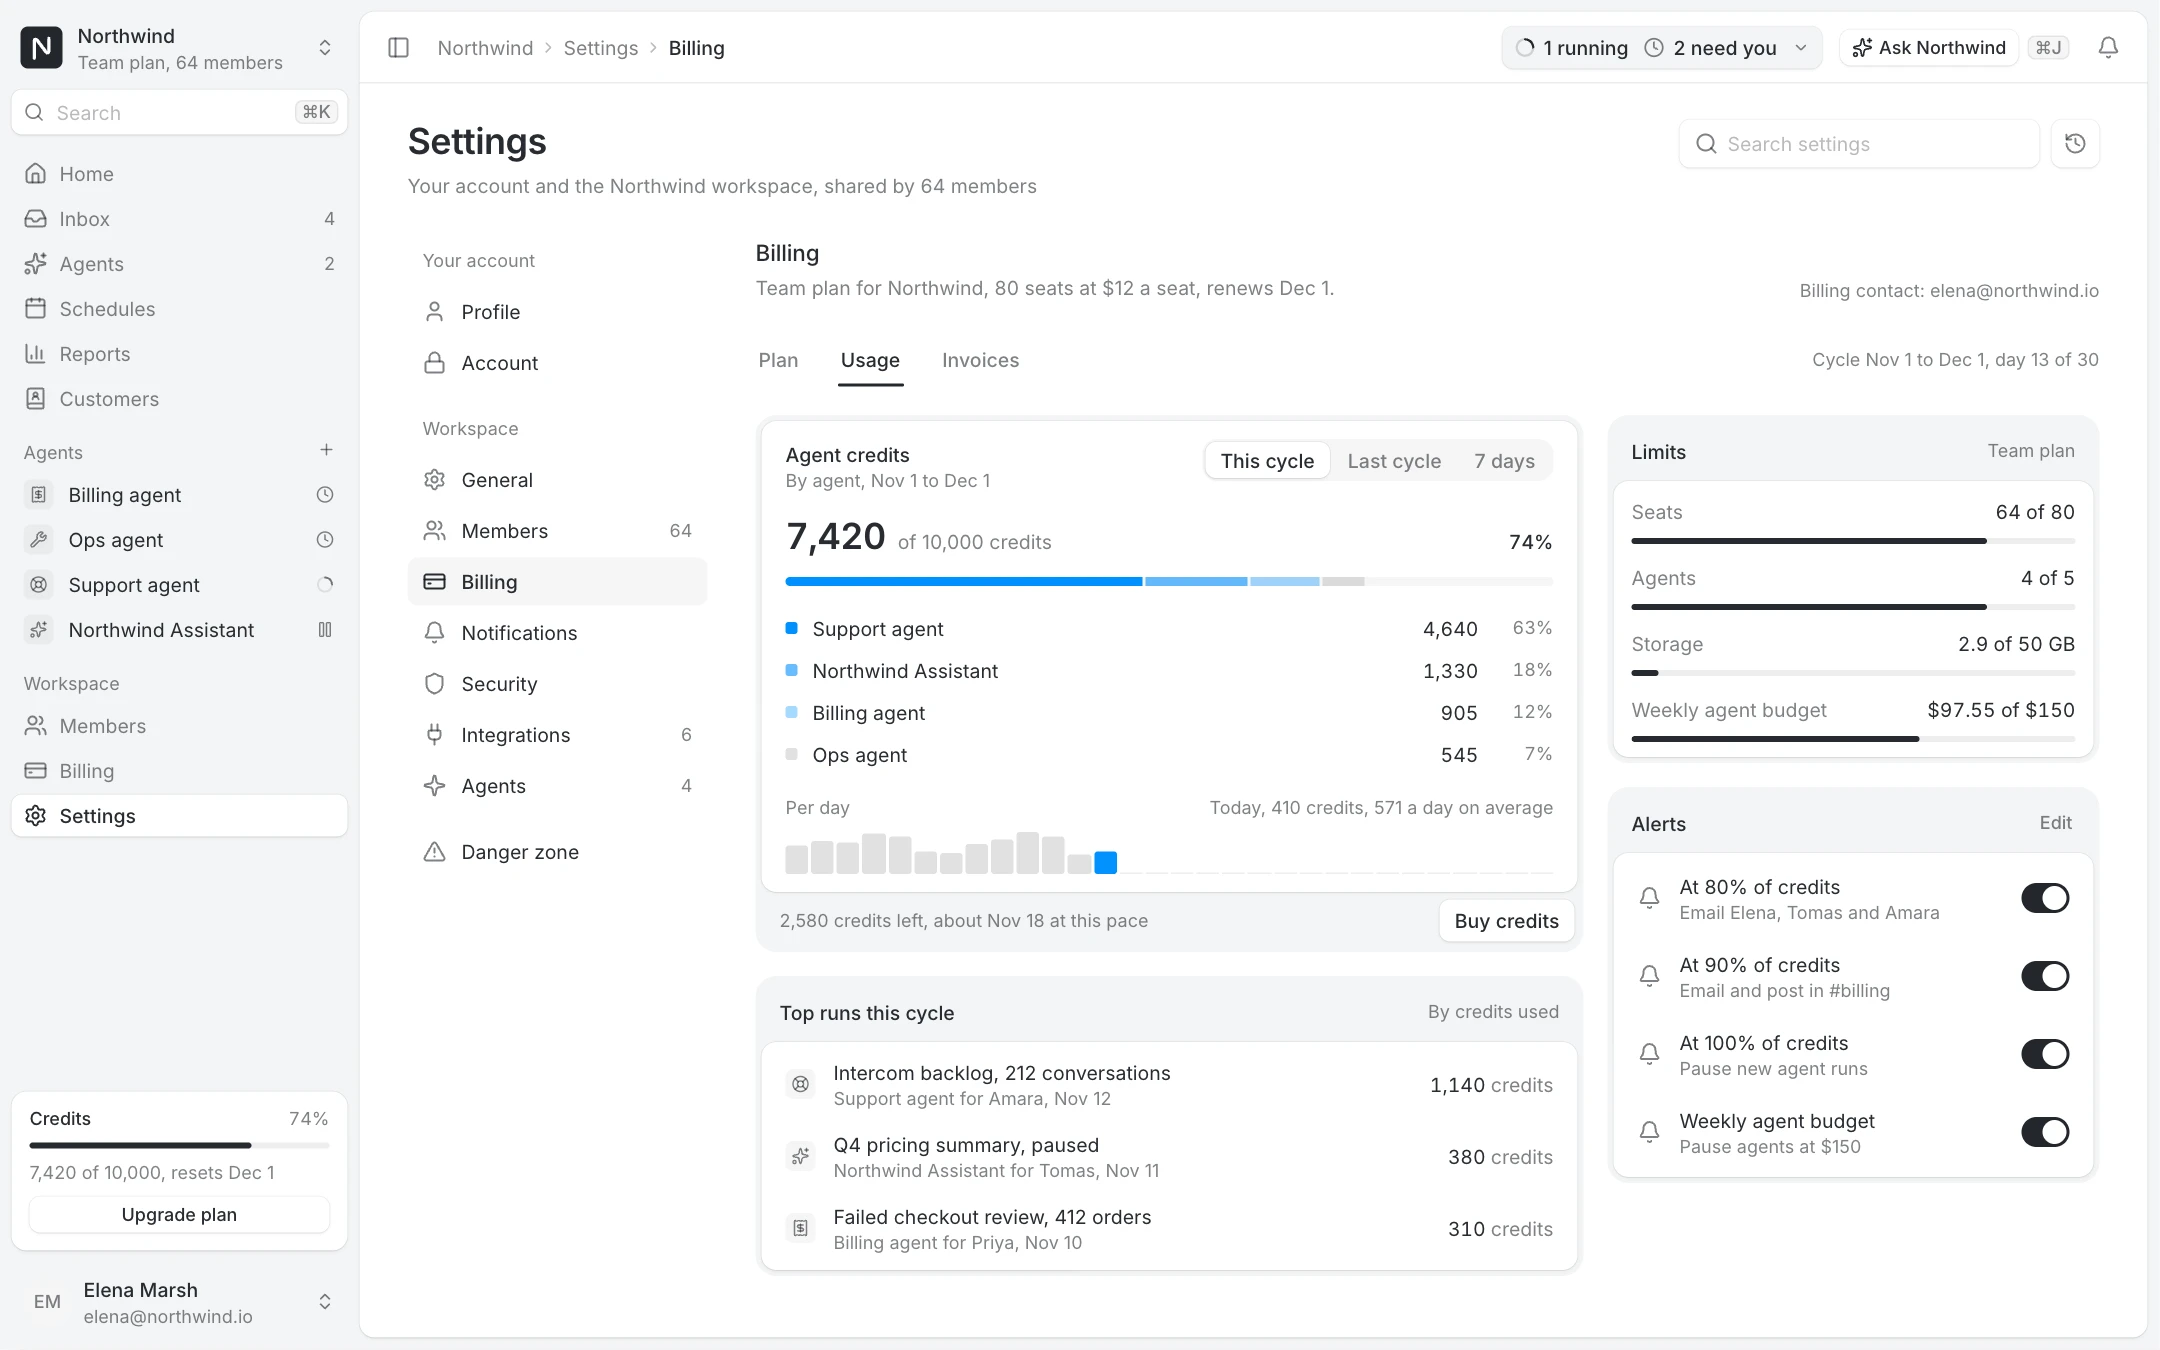
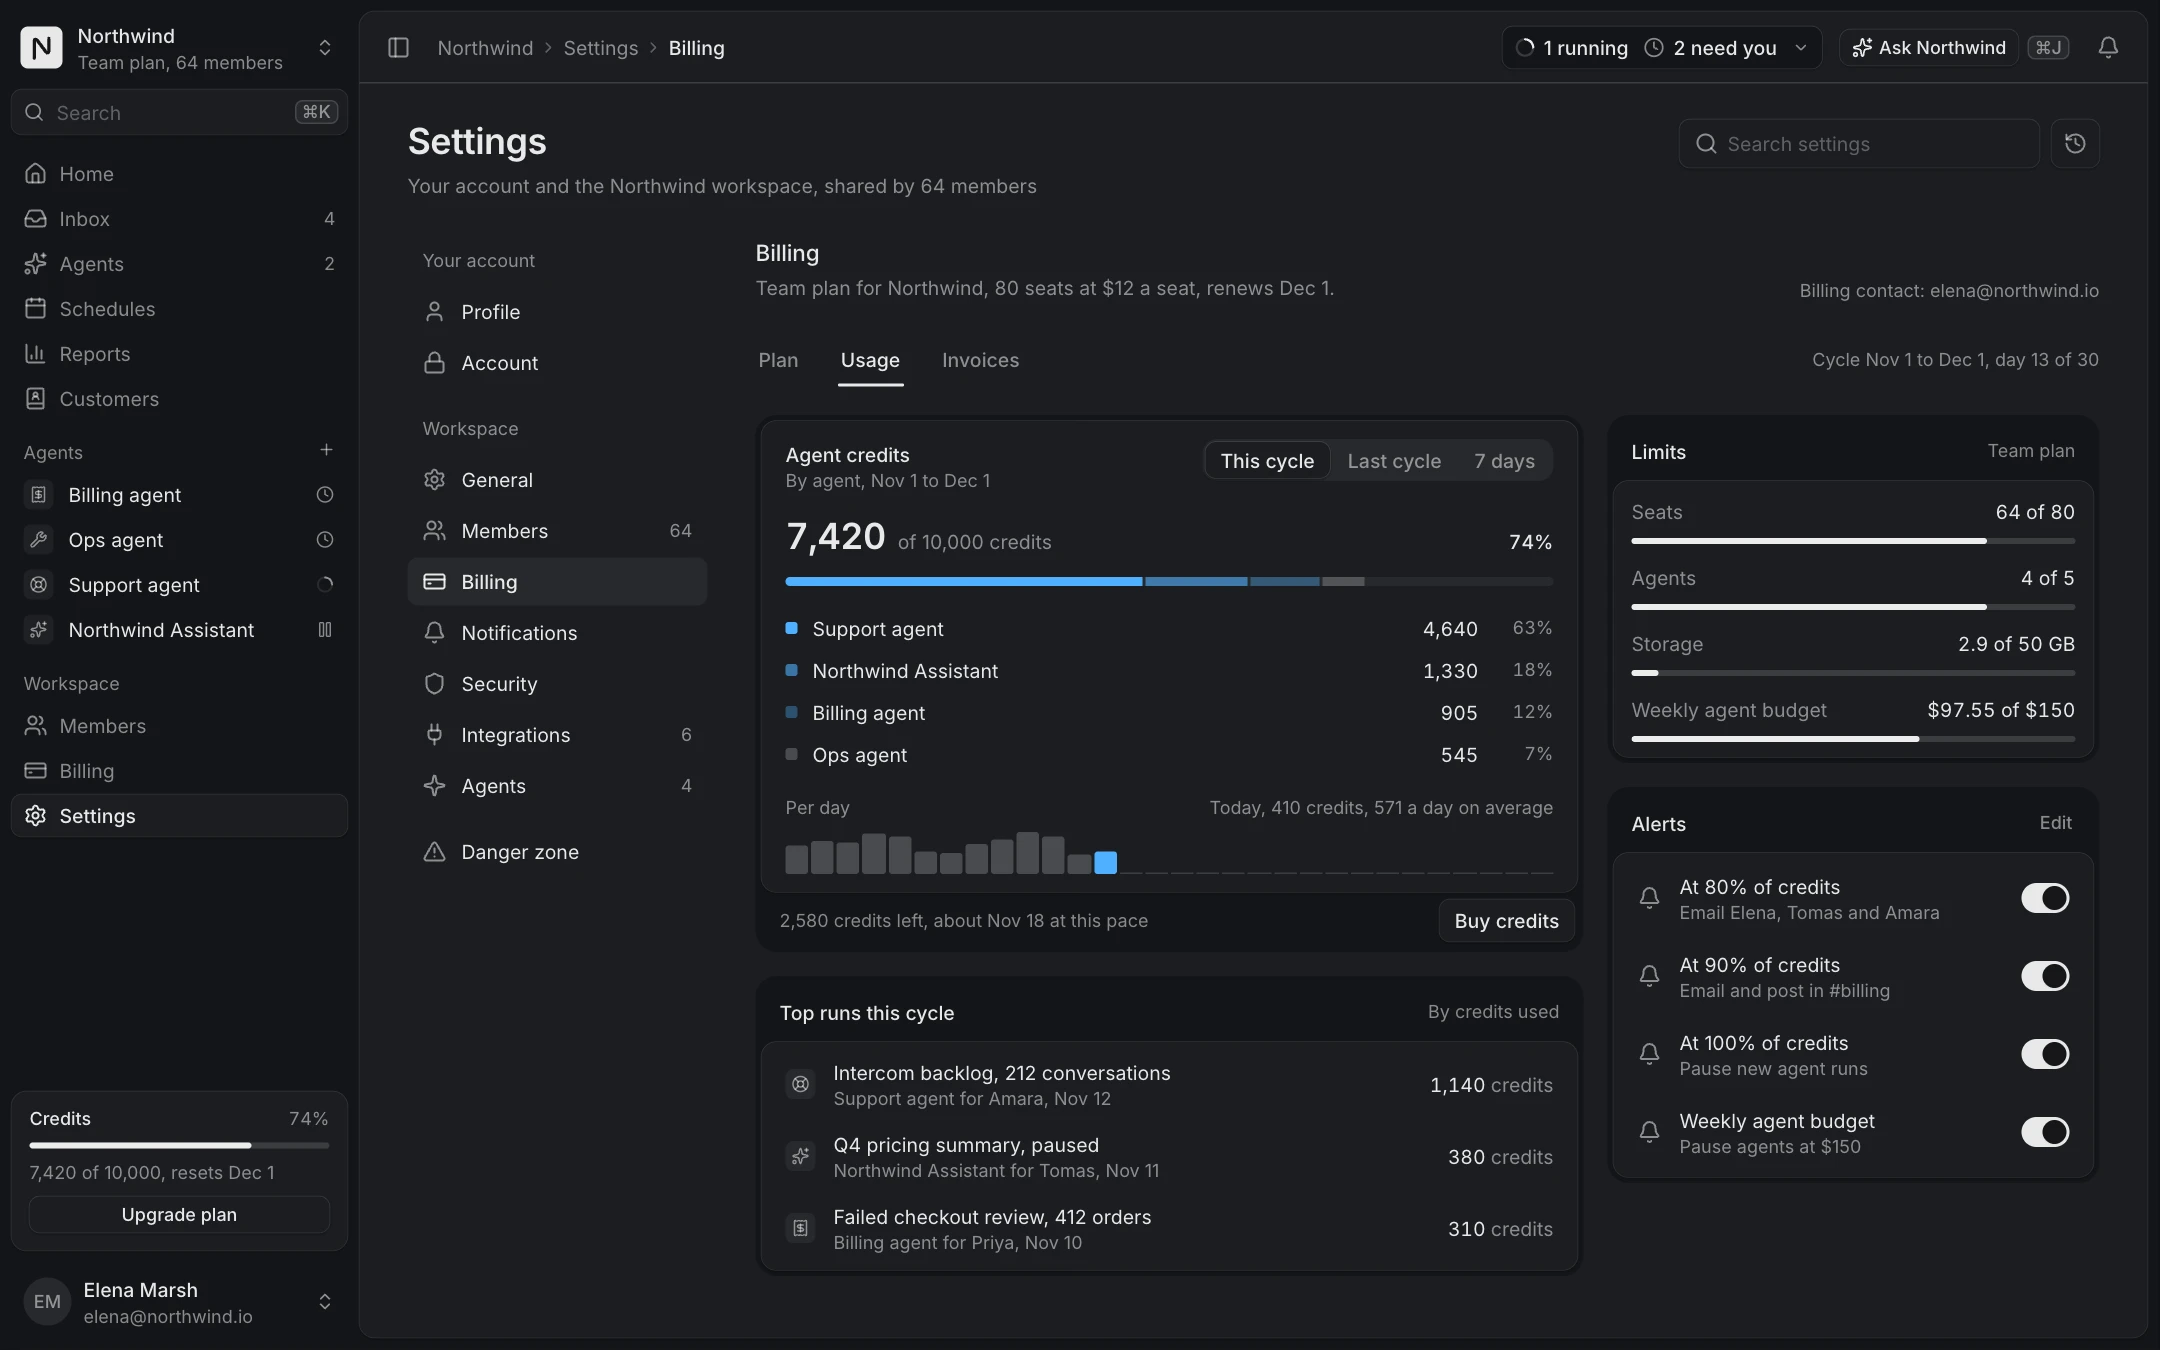
Usage and limits

Agent credits, limits for seats, agents and storage, usage alerts and the near-limit state.

Pro, unlock to copy

Pick the chart from the question

Most dashboard charts answer one of three questions. How is this number doing? Use the KPI chart: the headline value, its change against the previous period and a line per series, with a hover guide that reads the exact day. What is this total made of? Use the compact breakdown for a few parts in a single bar, or the breakdown chart when the split changes over time and people need to regroup it by measure. How close are we to the limit? Use the usage meter, which shows credits against the plan, the split by feature and a bar per day.

Starting from the question keeps a dashboard short. A row of KPI cards, one main chart, a breakdown and a usage card cover the home page of most SaaS products: the Dashboard overview screen is that layout, ready to wire to your API.

Built for real data, not a demo

Every chart takes plain arrays and numbers as props and formats amounts compactly ($94.5k rather than $94,512.40). Colours come from the theme tokens, so the series follow your brand in light and dark without touching the chart code.

With the live prop on, the demo streams a new day every few seconds so you can see how the chart behaves as data arrives. Set live to false, or let reduced motion do it, and the chart renders its still, complete state.

Install one, or the whole dashboard

Each chart is one file in your project after npx shadcn@latest add @joinery/kpi-chart. The KPI chart, the compact breakdown and the usage meter are free with an account. The breakdown chart and the analytics and usage screens come with Pro.

Questions

No. They are drawn in SVG inside the component, so there is no chart library to install or theme. The code is short enough to read and change.

Yes. A KPI chart works on a report page, in an email preview or in an agent answer. They size to their container.

Yes. They read the same tokens as the rest of the library, so light and dark come for free.

More collections

Dashboards and adminAI chat and agentsSettings and billing